Sep. 8, 2022.
In recent years I have been seeing Patriots fans claim that Bill Belichick is a bad drafter due to a few apparent draft busts and missed opportunities. I decided to look at the data to see whether that was really true or not. The short answer is, you could argue that there has been a downtrend in draft performance in the last decade or so of the Bill Belichick era, but there are several reasons to disagree that this trend is significant.
I collected data for every draft of the Superbowl era from Pro-Football-Reference. PFR keeps statistics calculates both the value each player delivers per season, as well as the total draft value that a player delivers for a team that drafted him, for every draft. Example here. DrAV just adds up the value a player contributes until that player stops playing for that team the first. Therefore it doesn’t take into account that value the team may have acquired in a trade, for example.
I calculated the average DrAV for each team in each draft that Belichick has been head coach and de facto GM of the Patriots (2000-2021). Then, for each year, I calculated the average DrAV per pick that team acquired, relative to all teams that year. We want a relative indicator because the gross amount of DrAV a team gets from a player can be affected by many things – it might be a strong or weak draft class, teams don’t have the same number of picks, etc. Also, some teams go through periods of dominance, rebuilding, or even tanking, which affects pick order, so if you are always picking first (last) in a round, you will be doing better (worse) for reasons other than your ability to identify and develop good prospects.
Under this metric I created, if team has a score of 1.00, that team got the average of amount of DrAV out of its draft class that year. If a team got a score of 1.25, it got 25% more DrAV from that draft class, indicating a better draft than average that year, and conversely 0.75 would mean 25% less. I also noticed that there is huge variability in relative performance year to year, and so I also calculated the standard deviation of relative performance over each year, so we could get some idea of when a draft was significantly better or worse than average.
The Patriots’ average relative draft performance is 1.06, so, since 2000, the Patriots have gotten about 6% more value than the average team. The standard deviation among average relative performances over the period was 0.11. Comparing the Patriots to other teams over this same period to see that they are tied for 8th out of 32. Not stellar, but not bad. We can see that better relative performance does generally contribute to better team performance (obviously).
| Rank | Team | Avg. Rel. Perf. | Made Playoffs | Won Div. | Won Conf. | Won SB |
|---|---|---|---|---|---|---|
| 1 | PIT | 1.22 | 14 | 10 | 3 | 2 |
| 2 | NOR | 1.18 | 10 | 8 | 1 | 1 |
| 3 | LAC | 1.15 | 7 | 5 | 0 | 0 |
| 4 | CAR | 1.14 | 8 | 5 | 2 | 0 |
| 4 | GNB | 1.14 | 16 | 13 | 1 | 1 |
| 6 | DAL | 1.12 | 8 | 6 | 0 | 0 |
| 7 | ATL | 1.10 | 8 | 4 | 1 | 28-3 |
| 8 | NYJ | 1.06 | 6 | 1 | 0 | 0 |
| 8 | BAL | 1.06 | 13 | 6 | 2 | 2 |
| 8 | NWE | 1.06 | 18 | 17 | 9 | 6 |
| 11 | CIN | 1.05 | 8 | 5 | 1 | 0 |
| 12 | IND | 1.04 | 16 | 9 | 2 | 1 |
| 12 | KAN | 1.04 | 11 | 8 | 2 | 1 |
| 14 | CHI | 1.02 | 6 | 5 | 1 | 0 |
| 15 | ARI | 1.01 | 5 | 3 | 1 | 0 |
| 15 | HOU | 1.01 | 6 | 6 | 0 | 0 |
| 17 | MIN | 0.99 | 8 | 5 | 0 | 0 |
| 18 | SEA | 0.97 | 14 | 9 | 3 | 1 |
| 19 | PHI | 0.96 | 14 | 9 | 2 | 1 |
| 19 | NYG | 0.96 | 8 | 4 | 3 | 2 |
| 21 | JAX | 0.95 | 3 | 1 | 0 | 0 |
| 21 | TEN | 0.95 | 9 | 5 | 0 | 0 |
| 23 | SFO | 0.93 | 7 | 4 | 2 | 0 |
| 24 | TAM | 0.92 | 7 | 4 | 2 | 2 |
| 24 | DET | 0.92 | 3 | 0 | 0 | 0 |
| 26 | DEN | 0.91 | 9 | 6 | 2 | 1 |
| 27 | BUF | 0.90 | 4 | 2 | 0 | 0 |
| 28 | MIA | 0.89 | 4 | 2 | 0 | 0 |
| 28 | WAS | 0.89 | 5 | 3 | 0 | 0 |
| 30 | LAR | 0.83 | 8 | 5 | 3 | 1 |
| 31 | LVR | 0.82 | 5 | 2 | 1 | 0 |
| 32 | CLE | 0.79 | 2 | 0 | 0 | 0 |
I also graphed the Patriots’ performance over time. The blue line in the graph below is relative performance year to year. The green line is the average over the entire Bill Belichick-Patriots era. The red lines mark +/- 1 standard deviation in relative performance that year. The grey line marks each individual year for ease of reading.
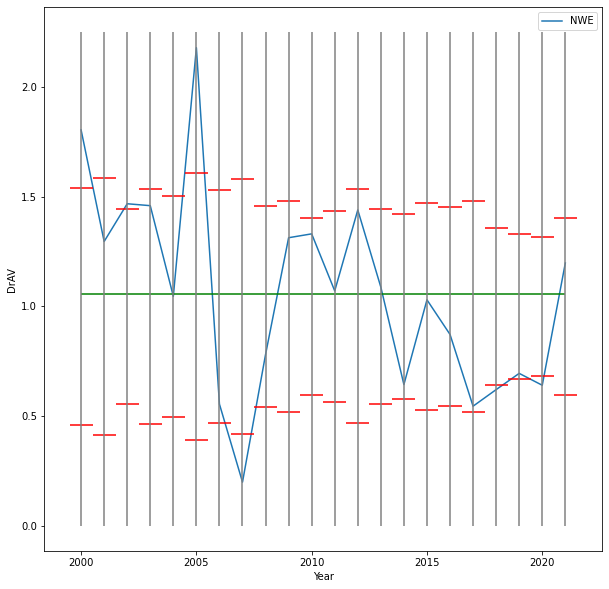
Although the Patriots are on the whole average, they were better in the 2000s and early 2010s, and have been consistently below average the past 9 years. One could argue from this that Belichick used to be good at drafting, but has fallen off over time.
However, there are several caveats to this argument. First, performance has been consistently low only in the most recent years. But a rookie contract is 4 years long, the average career length for a player who plays at least one game is about 6 years, and better players perform at a high level for longer than 4 years. It stands to reason that that the players drafted since 2015-19 possibly have not reached their full draft value for the Patriots (those that still play for the team). Although, by a cursory glance at the picks from these years, it doesn’t appear to me there is a huge amount value waiting to be unlocked in the players from before the 2020 draft.
Another factor is that the team has been going through something of a rebuilding period after its 2010s dynasty concluded. Tom Brady said in Man in the Arena that he knew that the Superbowl LIII in 2019 would be the team’s “last ride.” Since the performance of any individual player is dependent on team performance, it follows that if the rebuild is successful in the near future, the value of more recently drafted players could improve, if they still play for the team. Is the team not doing as well because of bad drafting? Or are draft picks getting fewer opportunities to produce and not developing as well because the veterans they play with are not as good? Hard to say.
There also might just be nothing going on. Given the wide variability in relative performance year to year, it would be easy to be fooled by randomness here. I simulated the performance of team that had the same relative performance as New England did (1.06 average relative performance, standard deviation year to year 0.46) over 22 years. This showed that 2/3 of such teams would have an actual average relative performance between 0.96 (19th) and 1.15 (3rd). So a team that is overall indistinguishable from New England in drafting skill might have easily come out at the top of the league, or in its bottom half. That suggests that the apparent downtrend and/or recent underperformance might just be illusory. It could just be a run of bad luck, or maybe an unusually large number of young players were better utilized as trades.
To reinforce this point, I will digress here and try to demonstrate why draft outcomes might inherently be subject to misleading trends. This is because the outcomes are likely determined by a small group of players who will become elite, but are very difficult to identify at the draft stage.
It appears to me that to get the best draft outcomes you should be aiming not just for the good players who have what it takes to play professionally, but specifically trying to look for that smaller and harder to identify group of ultra-high ceiling players who will contribute many times more than the average player. Why? As it turns out, the top players contribute a massively disproportionate share of draft value. The top 5% of all players in rounds 1-7 have contributed a whopping 37% of all total draft value. The top 5% of players within the round in which they were selected have contributed 25% of all total value.
In aiming for the outlier gigachad players, you will probably also acquire many of the merely good players. But the elite high-ceiling players are going to be the guys that make or break things. With 5 exceptions, no team since 2000 has ever had a superior draft year (greater than 1 standard deviation above average for the year) without drafting at least one player who ended up in the top 85% of all draftees in the Superbowl era. And those 5 exceptions are all in 2020 and 2021. Since it is way too early to expect that the full value of the 2020 and 2021 draft classes has been realized, those exceptions could easily disappear in the next couple seasons.
Even if you only get one future star, and the rest of your draft class is a bunch of bums, you will probably have an at least average year, if not a good or outstanding one. In 2011, with a second round bust in Terrell McClain DT, Carolina’s picks all contributed little or nothing to the team – all except for Cam Newton. Thanks to his 107 DrAV, Carolina actually had a slightly better than average draft that year.
To illustrate this, take a look at this boxplot, where the green line is the median, the box edges are 25th and 75th percentile, and the whiskers are at 5th and 95th percentile. The circles are the outlier players (that outlier way at the top in the 6th round – you know who that is!).

We can see clearly that the distribution of draft value among players is extremely right-skewed, meaning that the curve of value has a very heavy right tail. It also gets increasingly right skewed as rounds progress. In fact, later rounds are so right-skewed that for the last two rounds the median DrAV is 0.
| Rnd | 5th | 25th | 50th | 75th | 95th | Skew |
|---|---|---|---|---|---|---|
| 1 | 3 | 11 | 23 | 44 | 88.5 | 1.48 |
| 2 | 0 | 4 | 13 | 27 | 62 | 1.64 |
| 3 | 0 | 1 | 6 | 17 | 51 | 2.46 |
| 4 | 0 | 0 | 4 | 12 | 40 | 2.59 |
| 5 | 0 | 0 | 1 | 7 | 31 | 3.35 |
| 6 | 0 | 0 | 0 | 4 | 23 | 5.17 |
| 7 | 0 | 0 | 0 | 2 | 21 | 4.43 |
But, looking at the boxplot, we see that the late rounds are still producing significant numbers of outlier picks who are just as good or better than the median first-rounder! That’s the beauty of the heavy tail.
Now, since DrAV does not account for value acquired by trade, one could argue that this is because the later-round sleeper studs don’t get traded as often and stay with the team, maybe because in the first few seasons they still carry a stigma of being a late-rounder and only the teams that drafted them understands how their ceilings will be. One could also argue that teams fail to develop later round picks more than they do early rounders, possibly again because of the perception of a low-ceiling.
But I think this phenomena is better explained by the fact that, these sleeper studs are just getting overlooked. Otherwise, the median values for the late rounds would not be at or near zero. What’s happening is that most picks after the third round are just not going to contribute much. But this is clearly not because the supply of elite performers has been exhausted, as we can see from increasing right-skew of the curves for each round. So, if there remains a significant number picks deep into late rounds with the potential to be just as good as any early-rounder, but teams are somehow failing to acquire them and instead taking useless players, it must be because they just aren’t that good at identifying high-ceiling players outside the early rounds.
I modeled the draft value one should expect from the average draftee by overall pick order. It turns out the draft value apparently drops off exponentially by pick: Expected DrAV = 36.8 e(-0.0131n) where n is the overall pick order).
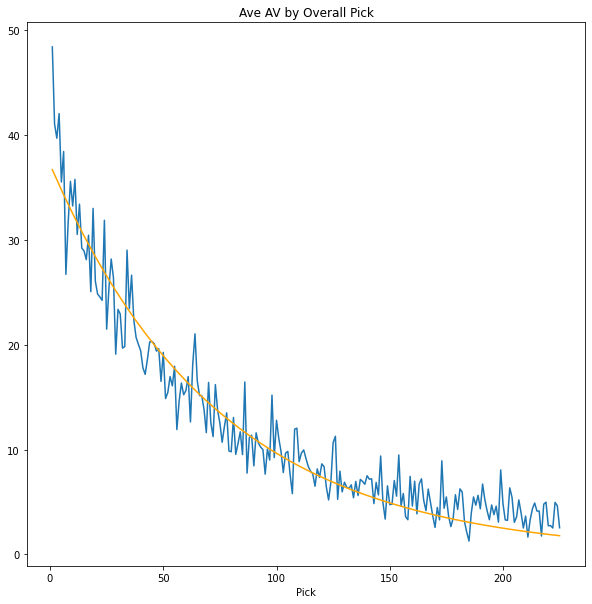
The model looks pretty good but seems to underestimate the top 1-3 picks, as well as the last 30-50. This fits with intuition that in most years, it is obvious who the top 3ish overall draft picks will be, and they tend not to get traded if they meet expectations. After that, value generally follows the exponential curve fitted here, if highly variable. When we get into very late picks in the 6th and 7th rounds, the model starts to underestimate value and diverge from the data.
I’d argue these facts support the notion that after the most obvious picks, many players who could be elite get overlooked until well into late rounds or perhaps are going undrafted. If teams were better at identifying high-ceiling players throughout the draft, I would guess that you would not see the curve gradually diverge at the end. That is because those high-ceiling players causing the divergence would have been drafted earlier.
As an aside, this also suggests teams should devote significant efforts to scouting UDFAs if they are not already doing so, or that perhaps the draft should be extended beyond 7 rounds, as it was in the past. As another aside, this might also demonstrate why Belichick’s notoriously favored strategy of trading down can be quite effective. If high-ceiling players are constantly overlooked by other teams throughout the draft, you can trade for players of proven ability, while still having a plenty of potentially elite players to select from among later-rounders. Therefore, you don’t lose much by picking later – if you can effectively find the players who have been overlooked.
Given how easy it is to overlook the relatively select group of players that will make or break your draft class, it is entirely possible that the apparent underperformance in recent years is not necessarily due to bad drafting. It could be just bad luck in trying to identify the high-ceiling players, and/or a high number of good but not great players who were better utilized as trades early on (so that their value to the team is not completely captured by DrAV).
Conclusion/TL;DR – During the Bill Belichick era, the Patriots have been average drafters overall, but with an apparent downtrend from better performance in the 2000s to underperformance in the 2010s. However, draft outcomes are highly variable year to year, particularly because it is easy to overlook the outstanding players who will contribute most of the value. Therefore, it is quite possible that the apparent downtrend is just an illusory result owing to a run of bad luck or other factors not relating to how well the team has been selecting draft picks.
