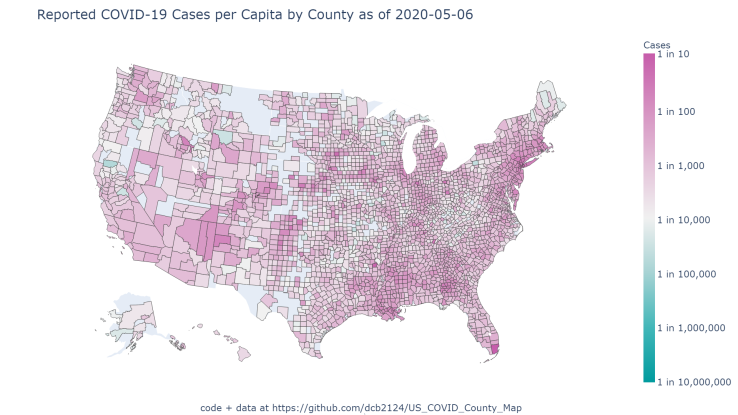
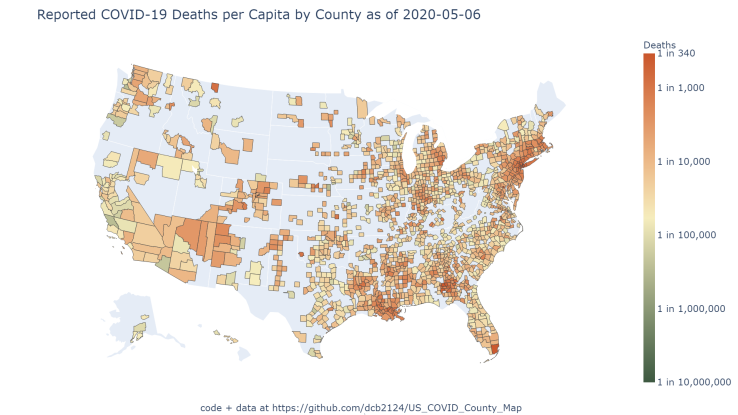
Data visualization – COVID-19 Cases and Deaths Per Capita. Posted on April 4, 2020May 8, 2020 by davidcbillingsley I made per capita maps of COVID-19 cases and deaths per capita. Here they are, as of 5/6/2020. More here. Share this: Share on X (Opens in new window) X Share on Facebook (Opens in new window) Facebook Like Loading...